Calculate Biodiversity Indicators Over Time
Source:R/calc_ts_methods.R, R/generic_functions.R
calc_ts.RdThis function provides a flexible framework for calculating various biodiversity indicators over time. It prepares the data, creates a grid, calculates indicators, and formats the output into an appropriate S3 object ('indicator_ts'). Specific implementations for different indicator types are provided using the appropriate wrappers.
Usage
# Default S3 method
calc_ts(x, ...)

# S3 method for class 'hill0'
calc_ts(x, ...)

# S3 method for class 'hill1'
calc_ts(x, ...)

# S3 method for class 'hill2'
calc_ts(x, ...)

# S3 method for class 'obs_richness'
calc_ts(x, ...)

# S3 method for class 'cum_richness'
calc_ts(x, ...)

# S3 method for class 'total_occ'
calc_ts(x, ...)

# S3 method for class 'occ_density'
calc_ts(x, ...)

# S3 method for class 'newness'
calc_ts(x, ...)

# S3 method for class 'williams_evenness'
calc_ts(x, ...)

# S3 method for class 'pielou_evenness'
calc_ts(x, ...)

# S3 method for class 'ab_rarity'
calc_ts(x, ...)

# S3 method for class 'area_rarity'
calc_ts(x, ...)

# S3 method for class 'spec_occ'
calc_ts(x, ...)

# S3 method for class 'spec_range'
calc_ts(x, ...)

# S3 method for class 'tax_distinct'
calc_ts(x, set_rows = 1, ...)

# S3 method for class 'occ_turnover'
calc_ts(x, ...)

calc_ts(x, ...)Value
An S3 object of the class 'indicator_ts' containing the calculated indicator values and metadata.
Examples
total_occurrences_trend <- total_occ_ts(example_cube_1)
#> [1] "All values of t are equal to 2 \n Cannot calculate confidence intervals"
#> [1] "All values of t are equal to 1 \n Cannot calculate confidence intervals"
#> [1] "All values of t are equal to 1 \n Cannot calculate confidence intervals"
#> [1] "All values of t are equal to 1 \n Cannot calculate confidence intervals"
#> [1] "All values of t are equal to 1 \n Cannot calculate confidence intervals"
#> [1] "All values of t are equal to 2 \n Cannot calculate confidence intervals"
#> [1] "All values of t are equal to 3 \n Cannot calculate confidence intervals"
#> [1] "All values of t are equal to 1 \n Cannot calculate confidence intervals"
#> [1] "All values of t are equal to 2 \n Cannot calculate confidence intervals"
#> [1] "All values of t are equal to 1 \n Cannot calculate confidence intervals"
#> [1] "All values of t are equal to 1 \n Cannot calculate confidence intervals"
#> [1] "All values of t are equal to 1 \n Cannot calculate confidence intervals"
#> [1] "All values of t are equal to 2 \n Cannot calculate confidence intervals"
#> [1] "All values of t are equal to 1 \n Cannot calculate confidence intervals"
#> [1] "All values of t are equal to 4 \n Cannot calculate confidence intervals"
#> [1] "All values of t are equal to 1 \n Cannot calculate confidence intervals"
#> [1] "All values of t are equal to 1 \n Cannot calculate confidence intervals"
#> [1] "All values of t are equal to 1 \n Cannot calculate confidence intervals"
#> [1] "All values of t are equal to 3 \n Cannot calculate confidence intervals"
#> [1] "All values of t are equal to 1 \n Cannot calculate confidence intervals"
#> [1] "All values of t are equal to 1 \n Cannot calculate confidence intervals"
#> [1] "All values of t are equal to 1 \n Cannot calculate confidence intervals"
#> [1] "All values of t are equal to 1 \n Cannot calculate confidence intervals"
#> [1] "All values of t are equal to 1 \n Cannot calculate confidence intervals"
#> [1] "All values of t are equal to 2 \n Cannot calculate confidence intervals"
#> [1] "All values of t are equal to 2 \n Cannot calculate confidence intervals"
#> [1] "All values of t are equal to 5 \n Cannot calculate confidence intervals"
#> [1] "All values of t are equal to 1 \n Cannot calculate confidence intervals"
#> [1] "All values of t are equal to 1 \n Cannot calculate confidence intervals"
#> [1] "All values of t are equal to 4 \n Cannot calculate confidence intervals"
#> [1] "All values of t are equal to 3 \n Cannot calculate confidence intervals"
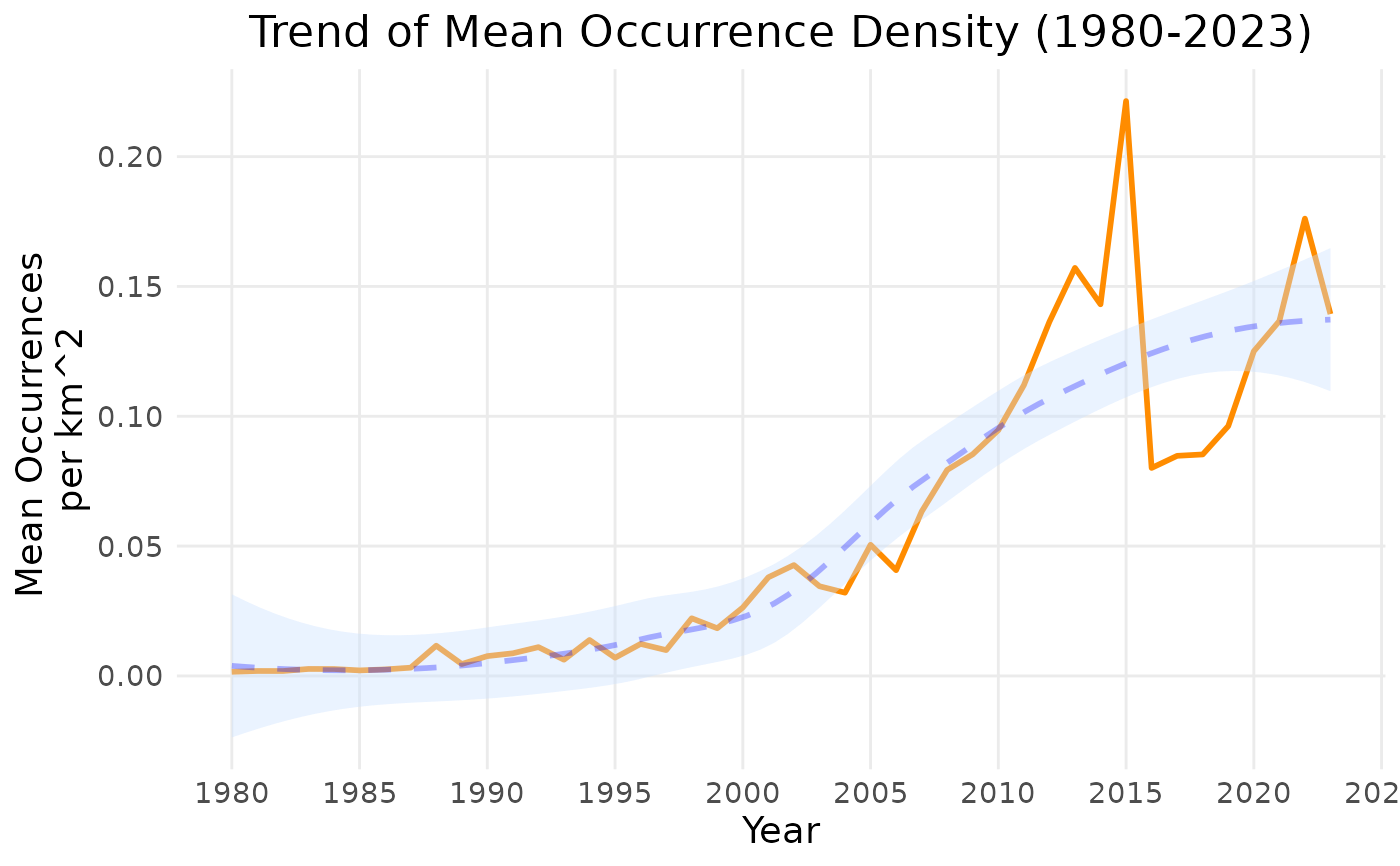
plot(total_occurrences_trend, min_year=1980)
