The goal of impIndicator is to allow users to seamlessly calculate and visualise the impact of alien taxa and individual species in a given area. It calculates and visualises potential impact per site as a map. It takes in Global Biodiversity Information Facility (GBIF) occurrence cube and EICAT assessment data. It enables users to choose from various methods of calculating impact indicators based on different assumptions.
The impIndicator produces three main products:
-
Species impact indicator with
compute_species_indicator(): The species impact produces the trends of individual alien species, enabling a species-specific impact attributed to invasions. This data supports comparisons of individual species’ impacts, revealing their roles and interactions within invaded area. The species impact is invaluable for prioritising species-specific management efforts, informing control and eradication strategies, and advancing research on alien species’ ecological roles and adaptation patterns. -
Site impact indicator with
compute_site_indicator(): The site impact as a map serves as a visual and analytical tool to represent the intensity of biological invasions across different parts of an area. By enabling spatial comparisons—such as between provinces, states, or conservation areas—, it highlights hotspots and areas at risk of invasion impact. This spatial data is useful for prioritising management actions, coordinating restoration projects, and fostering cross-regional collaboration to address alien species impacts effectively. -
Regional impact indicator with
compute_regional_indicator(): The impact indicator offers a nuanced representation of the trends of biological invasions of an area (local, regional, or global scales). By tracking the increase and decrease of ecological threats over time, this product provides insights into the dynamics of alien species impacts, helping assess whether current management practices are effective or need adjustment. The temporal analysis of impact indicator enables targeted resource allocation, fostering proactive interventions to mitigate biodiversity loss and ecosystem degradation.
Installation
Install impIndicator in R:
install.packages("impIndicator", repos = c("https://b-cubed-eu.r-universe.dev", "https://cloud.r-project.org"))You can install the development version from GitHub with:
# install.packages("remotes")
remotes::install_github("b-cubed-eu/impIndicator")
Demonstration
We demonstrate the computation and visualisation of impact indicator of biological invasions using the impIndicator package: compute_regional_indicator() to compute impact indicators of alien taxa, compute_species_indicator() to compute impact indicators per species, and compute_site_indicator() to compute impact indicators per site. The functions require (1) a species occurrence cube processed by the b3gbi::process_cube() and (2) Environmental Impact Classification for Alien Taxa (EICAT) data of species. Go to vignette("Background", package = "impIndicator") to read more about these functions.
# Load packages
library(impIndicator)

library(b3gbi)     # General biodiversity indicators for data cubes
library(tidyverse)   # Visualisation
library(dubicube)  # Data sensitivity and uncertainty estimation
Process occurrence cube
The cube_acacia_SA is a GBIF occurrence cube of Acacia species in South Africa, processed with the process_cube() function in b3gbi package. The cube_acacia_SA grid is an extended quarter degree cell, thus specified for the process_cube. The first_year and last_year arguments define the temporal range of the cube, restricting the processed occurrences to records between first_year and last_year.
# Process GBIF Acacia occurrence cube
acacia_cube <- process_cube(cube_name = cube_acacia_SA,
                            grid_type = "eqdgc",
                            first_year = 2010,
                            last_year = 2024)
acacia_cube
#>
#> Processed data cube for calculating biodiversity indicators
#>
#> Date Range: 2010 - 2024
#> Single-resolution cube with cell size 0.25degrees
#> Number of cells: 461
#> Grid reference system: eqdgc
#> Coordinate range:
#>   xmin   xmax   ymin   ymax
#>   8.00  31.75 -35.00 -22.75
#>
#> Total number of observations: 19431
#> Number of species represented: 36
#> Number of families represented: 1
#>
#> Kingdoms represented: Plantae
#>
#> First 10 rows of data (use n = to show more):
#>
#> # A tibble: 3,604 × 11
#>     year cellCode  taxonKey scientificName      obs kingdom family
#>    <dbl> <chr>        <dbl> <chr>             <dbl> <chr>   <chr>
#>  1  2010 E018S32AD  2980425 Acacia cyclops        1 Plantae Fabaceae
#>  2  2010 E018S33CD  2979793 Acacia viscidula      1 Plantae Fabaceae
#>  3  2010 E018S33CD  2980425 Acacia cyclops        1 Plantae Fabaceae
#>  4  2010 E018S34AB  2978369 Acacia ulicifolia     1 Plantae Fabaceae
#>  5  2010 E018S34AB  2978604 Acacia pycnantha      1 Plantae Fabaceae
#>  6  2010 E018S34AB  2978552 Acacia saligna        6 Plantae Fabaceae
#>  7  2010 E018S34AB  2979232 Acacia implexa        4 Plantae Fabaceae
#>  8  2010 E019S34AA  2978604 Acacia pycnantha      1 Plantae Fabaceae
#>  9  2010 E020S33DC  2979775 Acacia mearnsii       3 Plantae Fabaceae
#> 10  2010 E029S30DD  2979775 Acacia mearnsii       2 Plantae Fabaceae
#> # ℹ 3,594 more rows
#> # ℹ 4 more variables: minCoordinateUncertaintyInMeters <dbl>, xcoord <dbl>,
#> #   ycoord <dbl>, resolution <chr>
EICAT assessment data
The Environmental Impact Classification for Alien Taxa (EICAT) assessment data is the reported impact of alien taxa based on EICAT method which is the International Union for Conservation of Nature (IUCN) standard. An assessed alien taxa with adequate data is classified into massive (MV), major (MR), moderate (MO), minor (MN), or minimal concern (MC) depending on the severity of the impact caused on recipient ecosystem. Additional information such as the mechanisms and location of impact are also recorded. An example of an EICAT dataset is:
# View EICAT data
head(eicat_acacia, 10)
#> # A tibble: 10 × 3
#>    scientific_name   impact_category impact_mechanism
#>    <chr>             <chr>           <chr>
#>  1 Acacia saligna    MC              (1) Competition
#>  2 Acacia saligna    MC              (12) Indirect impacts through interaction …
#>  3 Acacia saligna    MC              (1) Competition
#>  4 Acacia saligna    MC              (1) Competition; (9) Chemical impact on th…
#>  5 Acacia mearnsii   MC              (6) Poisoning/toxicity
#>  6 Acacia longifolia MC              (9) Chemical impact on ecosystems
#>  7 Acacia dealbata   MC              (9) Chemical impact on ecosystems
#>  8 Acacia dealbata   MC              (9) Chemical impact on ecosystems
#>  9 Acacia saligna    MC              (9) Chemical impact on ecosystems
#> 10 Acacia dealbata   MC              (12) Indirect impacts through interaction …
Species impact indicator
We compute the impact indicator per species by combining the impact score and occurrence of individual species. compute_species_indicator() use max (maximum), mean or max_mech (sum of maximum score per mechanism) method to compute the impact per species. Interval calculation is not implemented yet.
# Impact indicator per species
species_value <- compute_species_indicator(
  cube = acacia_cube,
  impact_data = eicat_acacia,
  method = "mean",
  ci_type = "none"
)

# Visualise species impact
plot(species_value)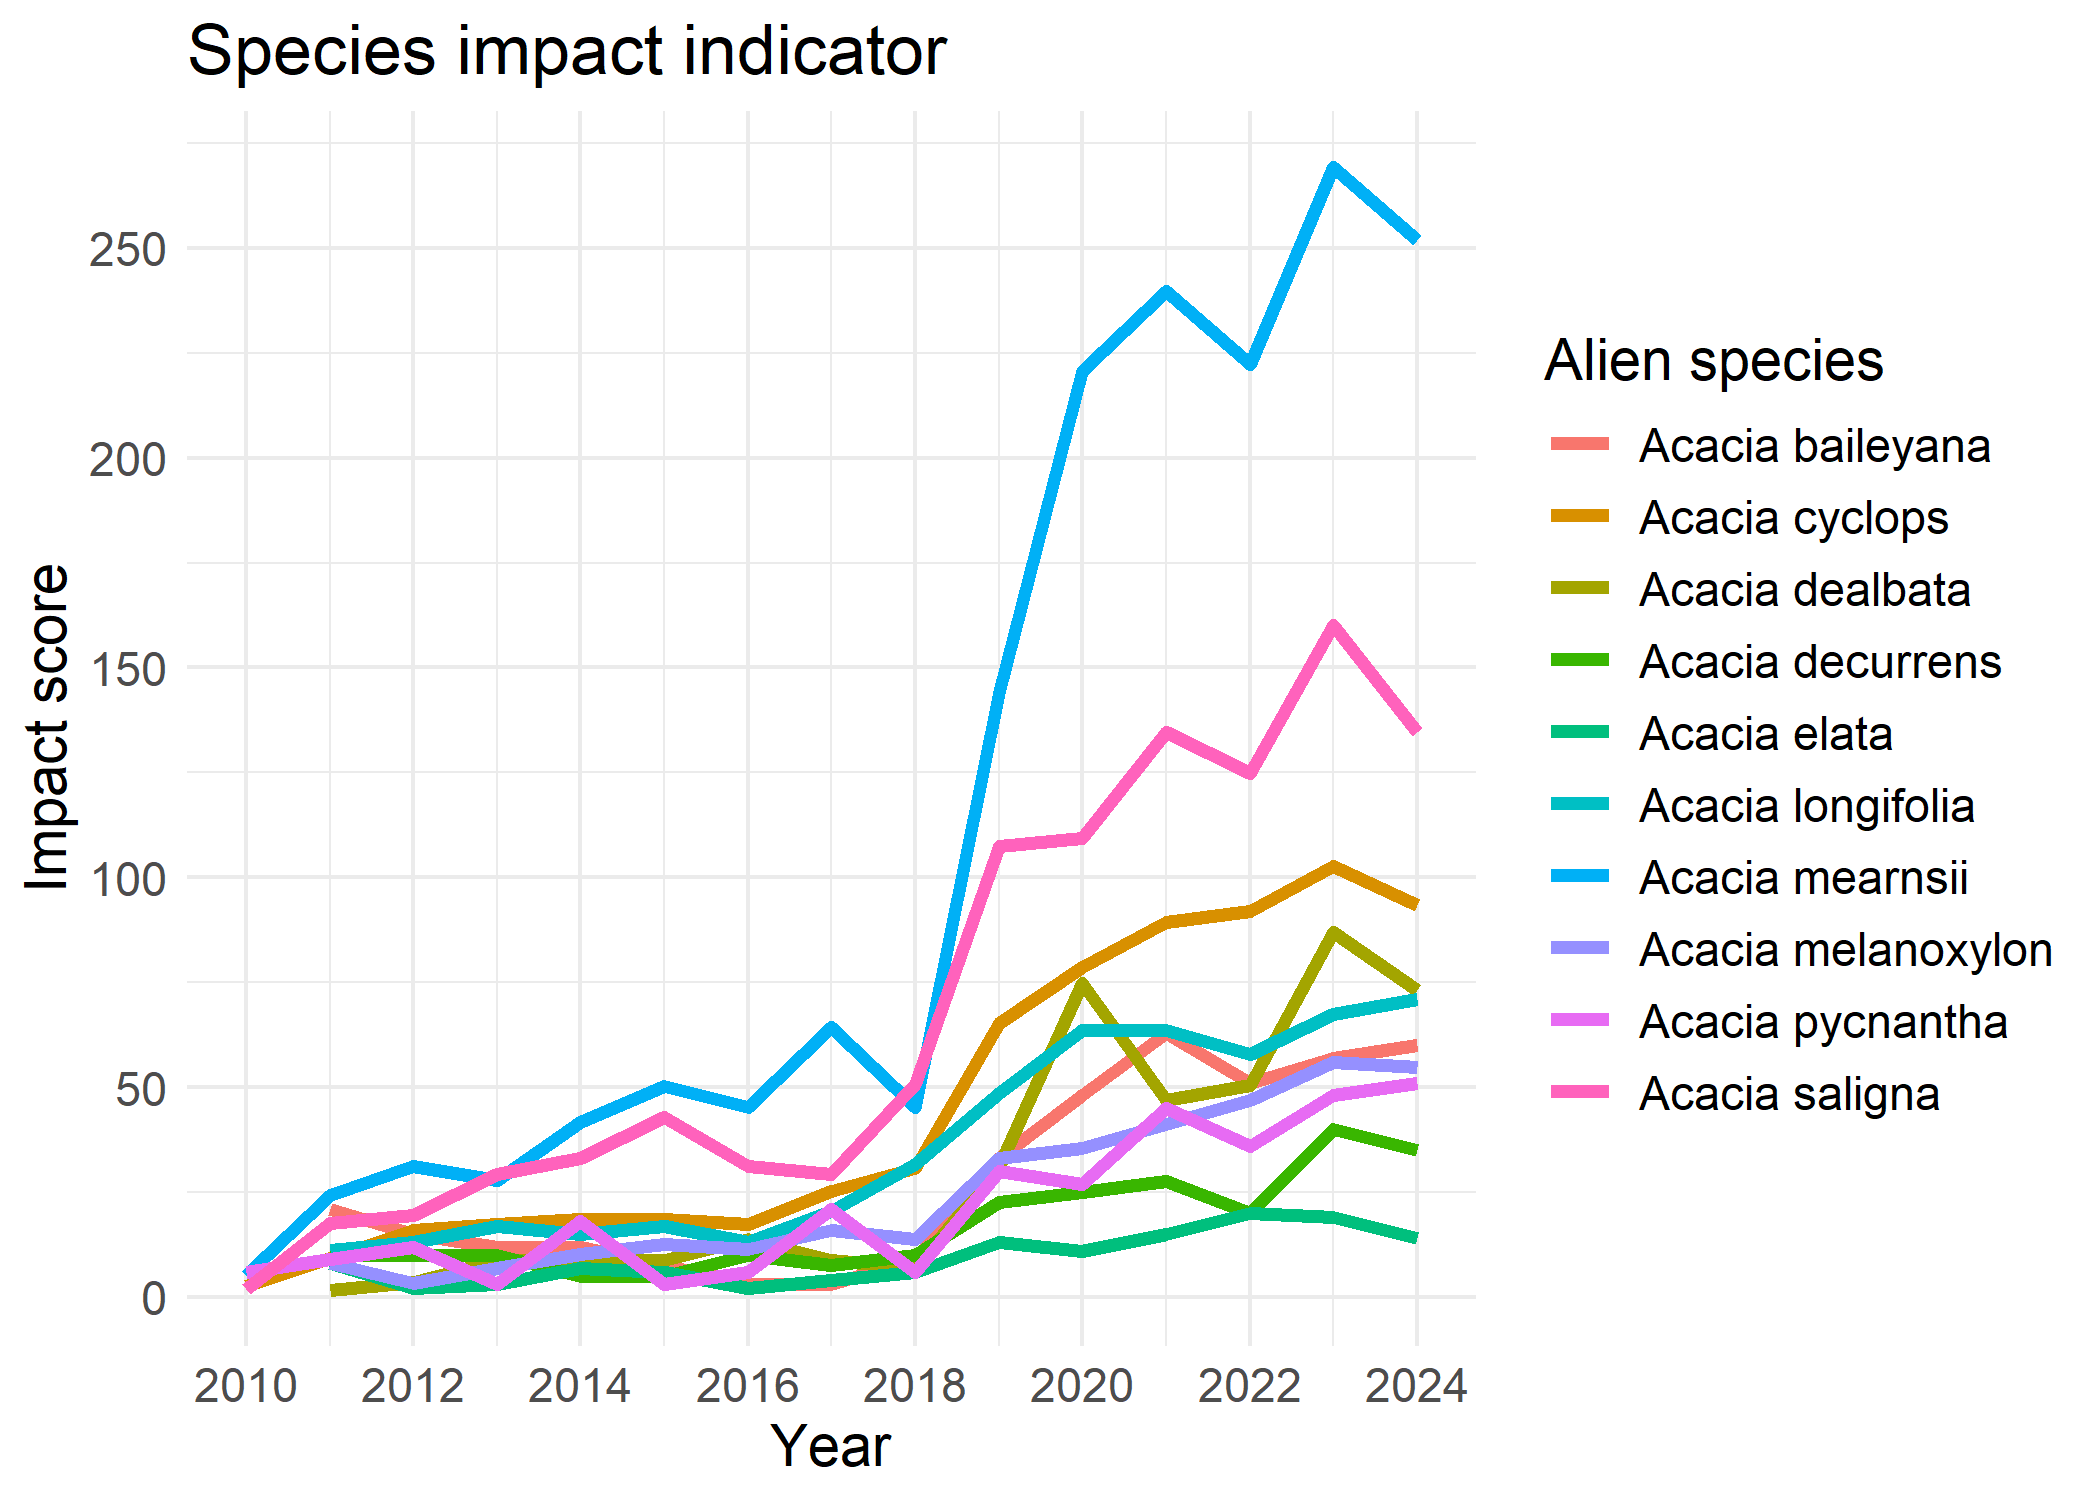
Site impact indicator
The impact per site is a risk map that shows the impact score for each site, where multiple species can be present. To compute the impact map per site, aggregated scores across species at each site are needed. The compute_site_indicator() uses max, sum and mean metrics to aggregate impact scores within species and across species in a site as proposed by Boulesnane-Guengant et al. (2025). The combinations of within species aggregation metrics for each species and across species for each site leads to five methods of calculating an impact indicator, namely,
- precaut (precautionary),
- precaut_cum (precautionary cumulative),
- mean,
- mean_cum (mean cumulative) and
- cum (cumulative).
siteImpact <- compute_site_indicator(
  cube = acacia_cube,
  impact_data = eicat_acacia,
  method = "mean_cum"
)

# Impact map
# Visualise last four years for readability
plot(x = siteImpact, region = southAfrica_sf, first_year = 2021)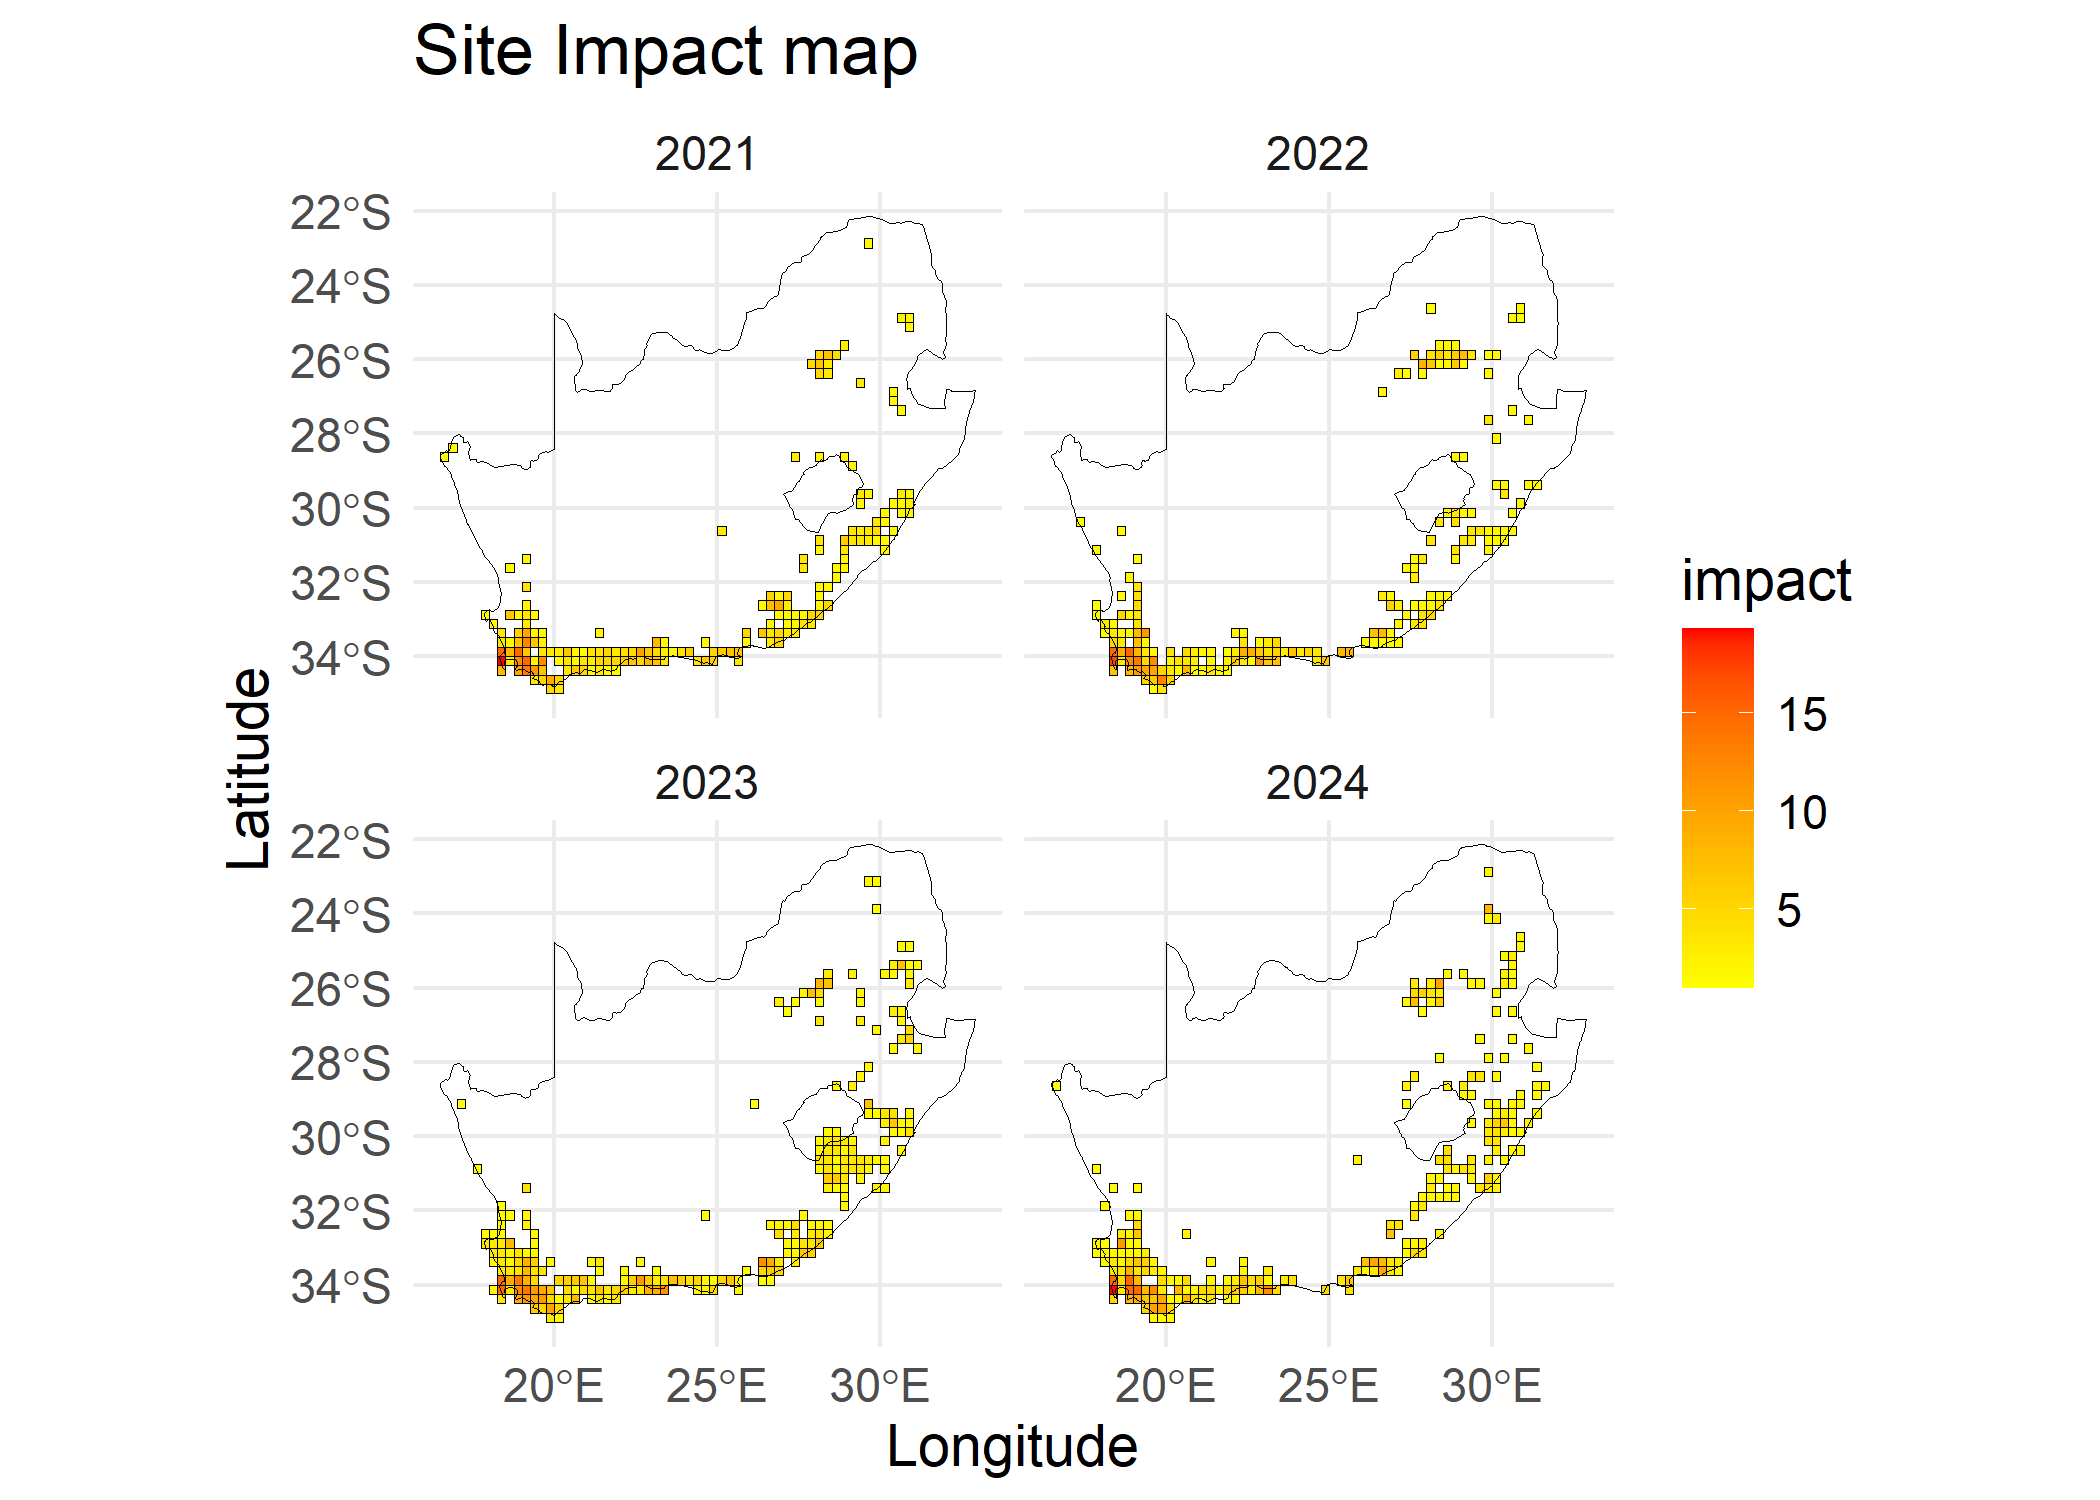
Regional impact indicator
To compute the impact indicator of alien taxa, we sum all the yearly impact scores of each site of the study region. The impact indicator use one of the methods named above in the impact per site. The ci_type argument allows the function compute_regional_indicator() to calculate the confidence interval of the regional impact indicator using a bootstrapping method via the dubicube package. The seed = 123 makes the bootstrap to generate same random sample for reproducibility.
# Regional impact indicator
impactIndicator <- compute_regional_indicator(
  cube = acacia_cube,
  impact_data = eicat_acacia,
  method = "mean_cum",
  ci_type = "perc",
  boot_args = list(seed = 123)
)
#> [1] "Performing whole-cube bootstrap."

# Visualise impact indicator
plot(impactIndicator, trend = "smooth")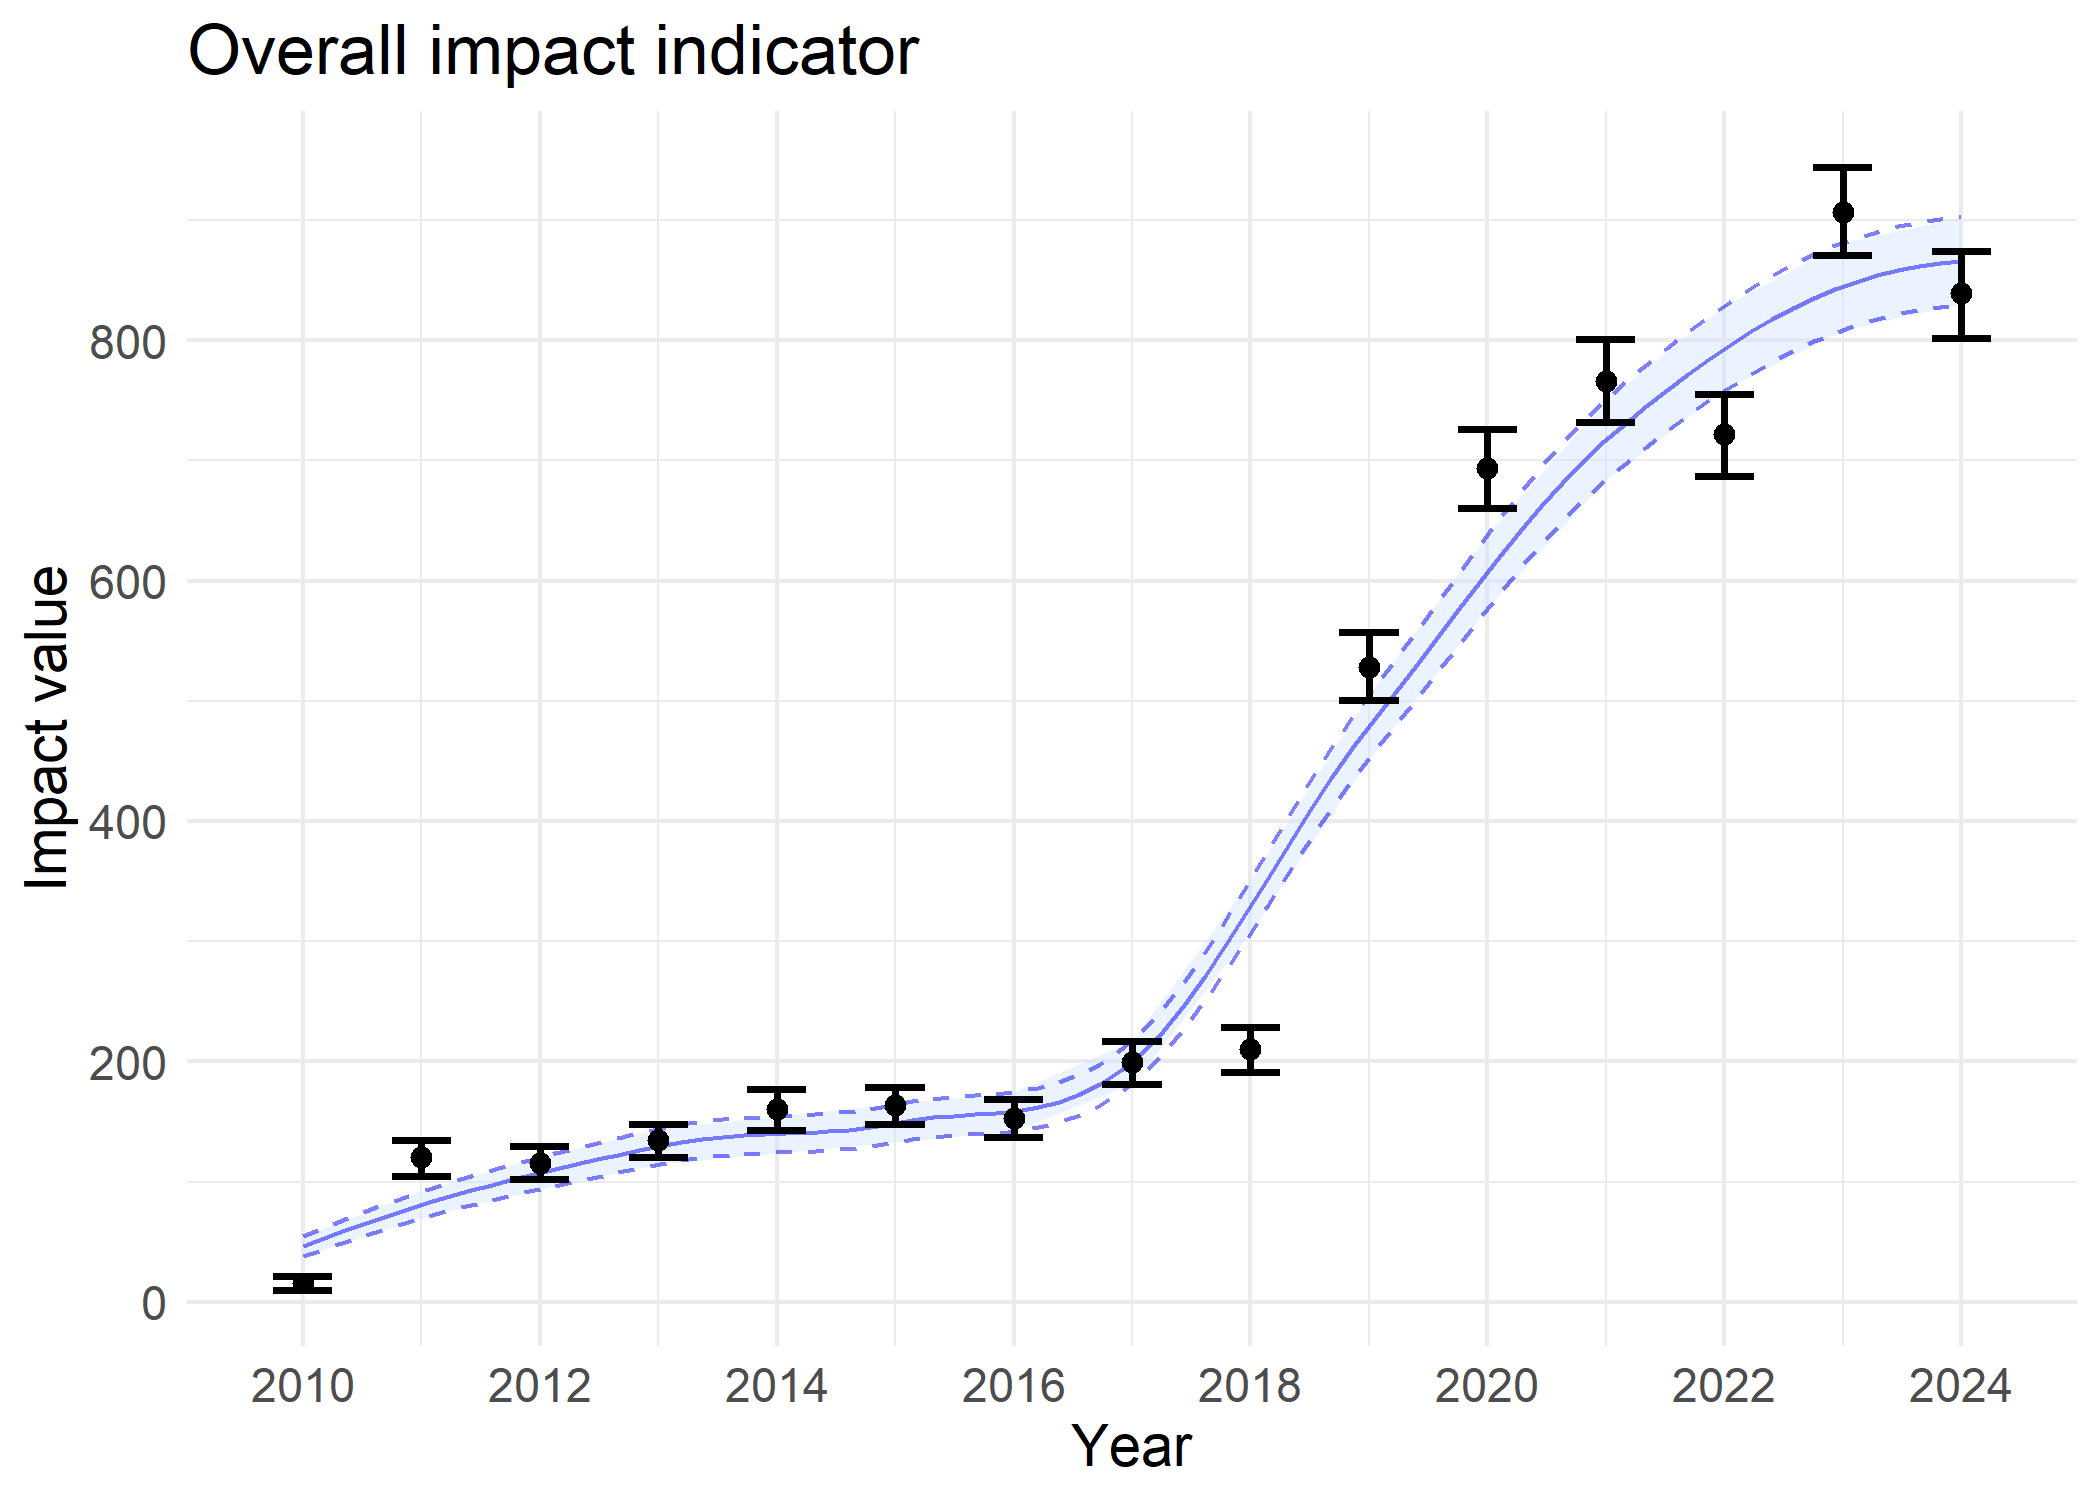
Sensitivity analysis
To estimate how the impact indicator is sensitive to a taxon and indicating how the taxon e.g., species can disproportionately influence the impact indicator. We can use a leave-one-species-out cross-validation (LOSO-CV) technique. This technique evaluates the extent to which the regional indicator is driven by individual species by systematically recalculating the indicator after excluding one species at a time and comparing the resulting values to those obtained from the full occurrence cube. The deviation between the left out species indicator and the full-data indicator provides a measure of error attributable to species omission and can be summarised using the root mean square error (RMSE) for each year. RMSE values indicate whether observed trends are robust or disproportionately influenced by particular species. We use the cross_validation_cube() from dubicube package to perform the LOSO-CV. Details and tutorial about the LOSO-CV calculation can be found here https://b-cubed-eu.github.io/dubicube/articles/group-level-sensitivity.html
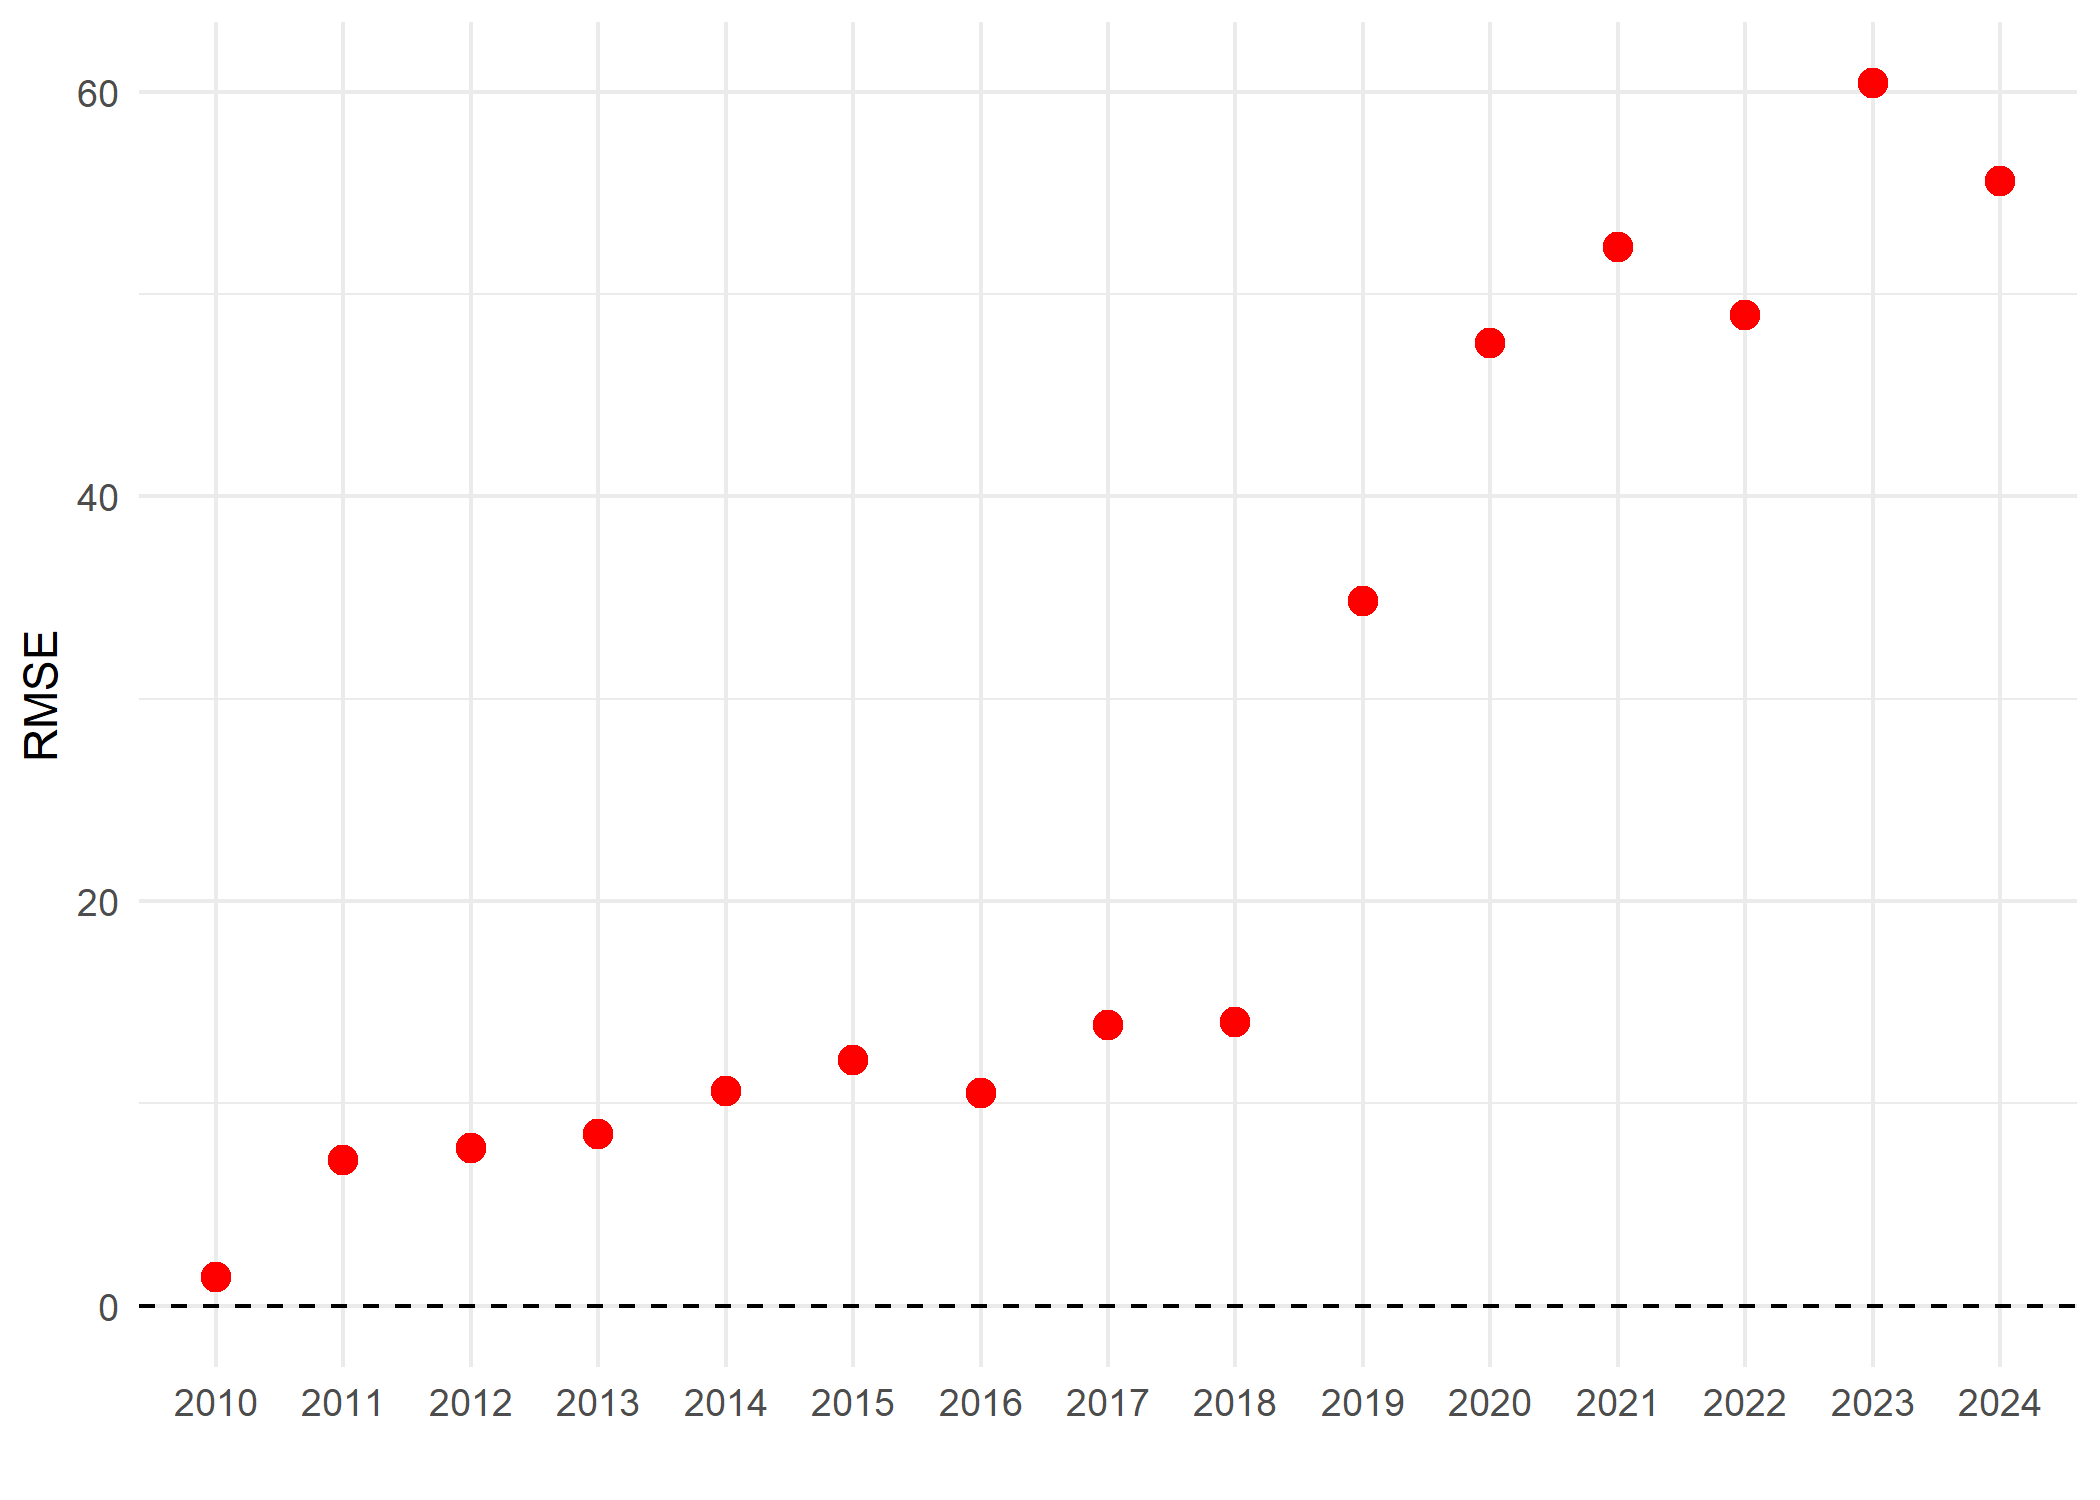
The above plot shows the RMSE of the impact indicator of Acacia species is South Africa. The figure indicates the values from the year 2019 are sensitive or dominated by some individual species in the indicator.
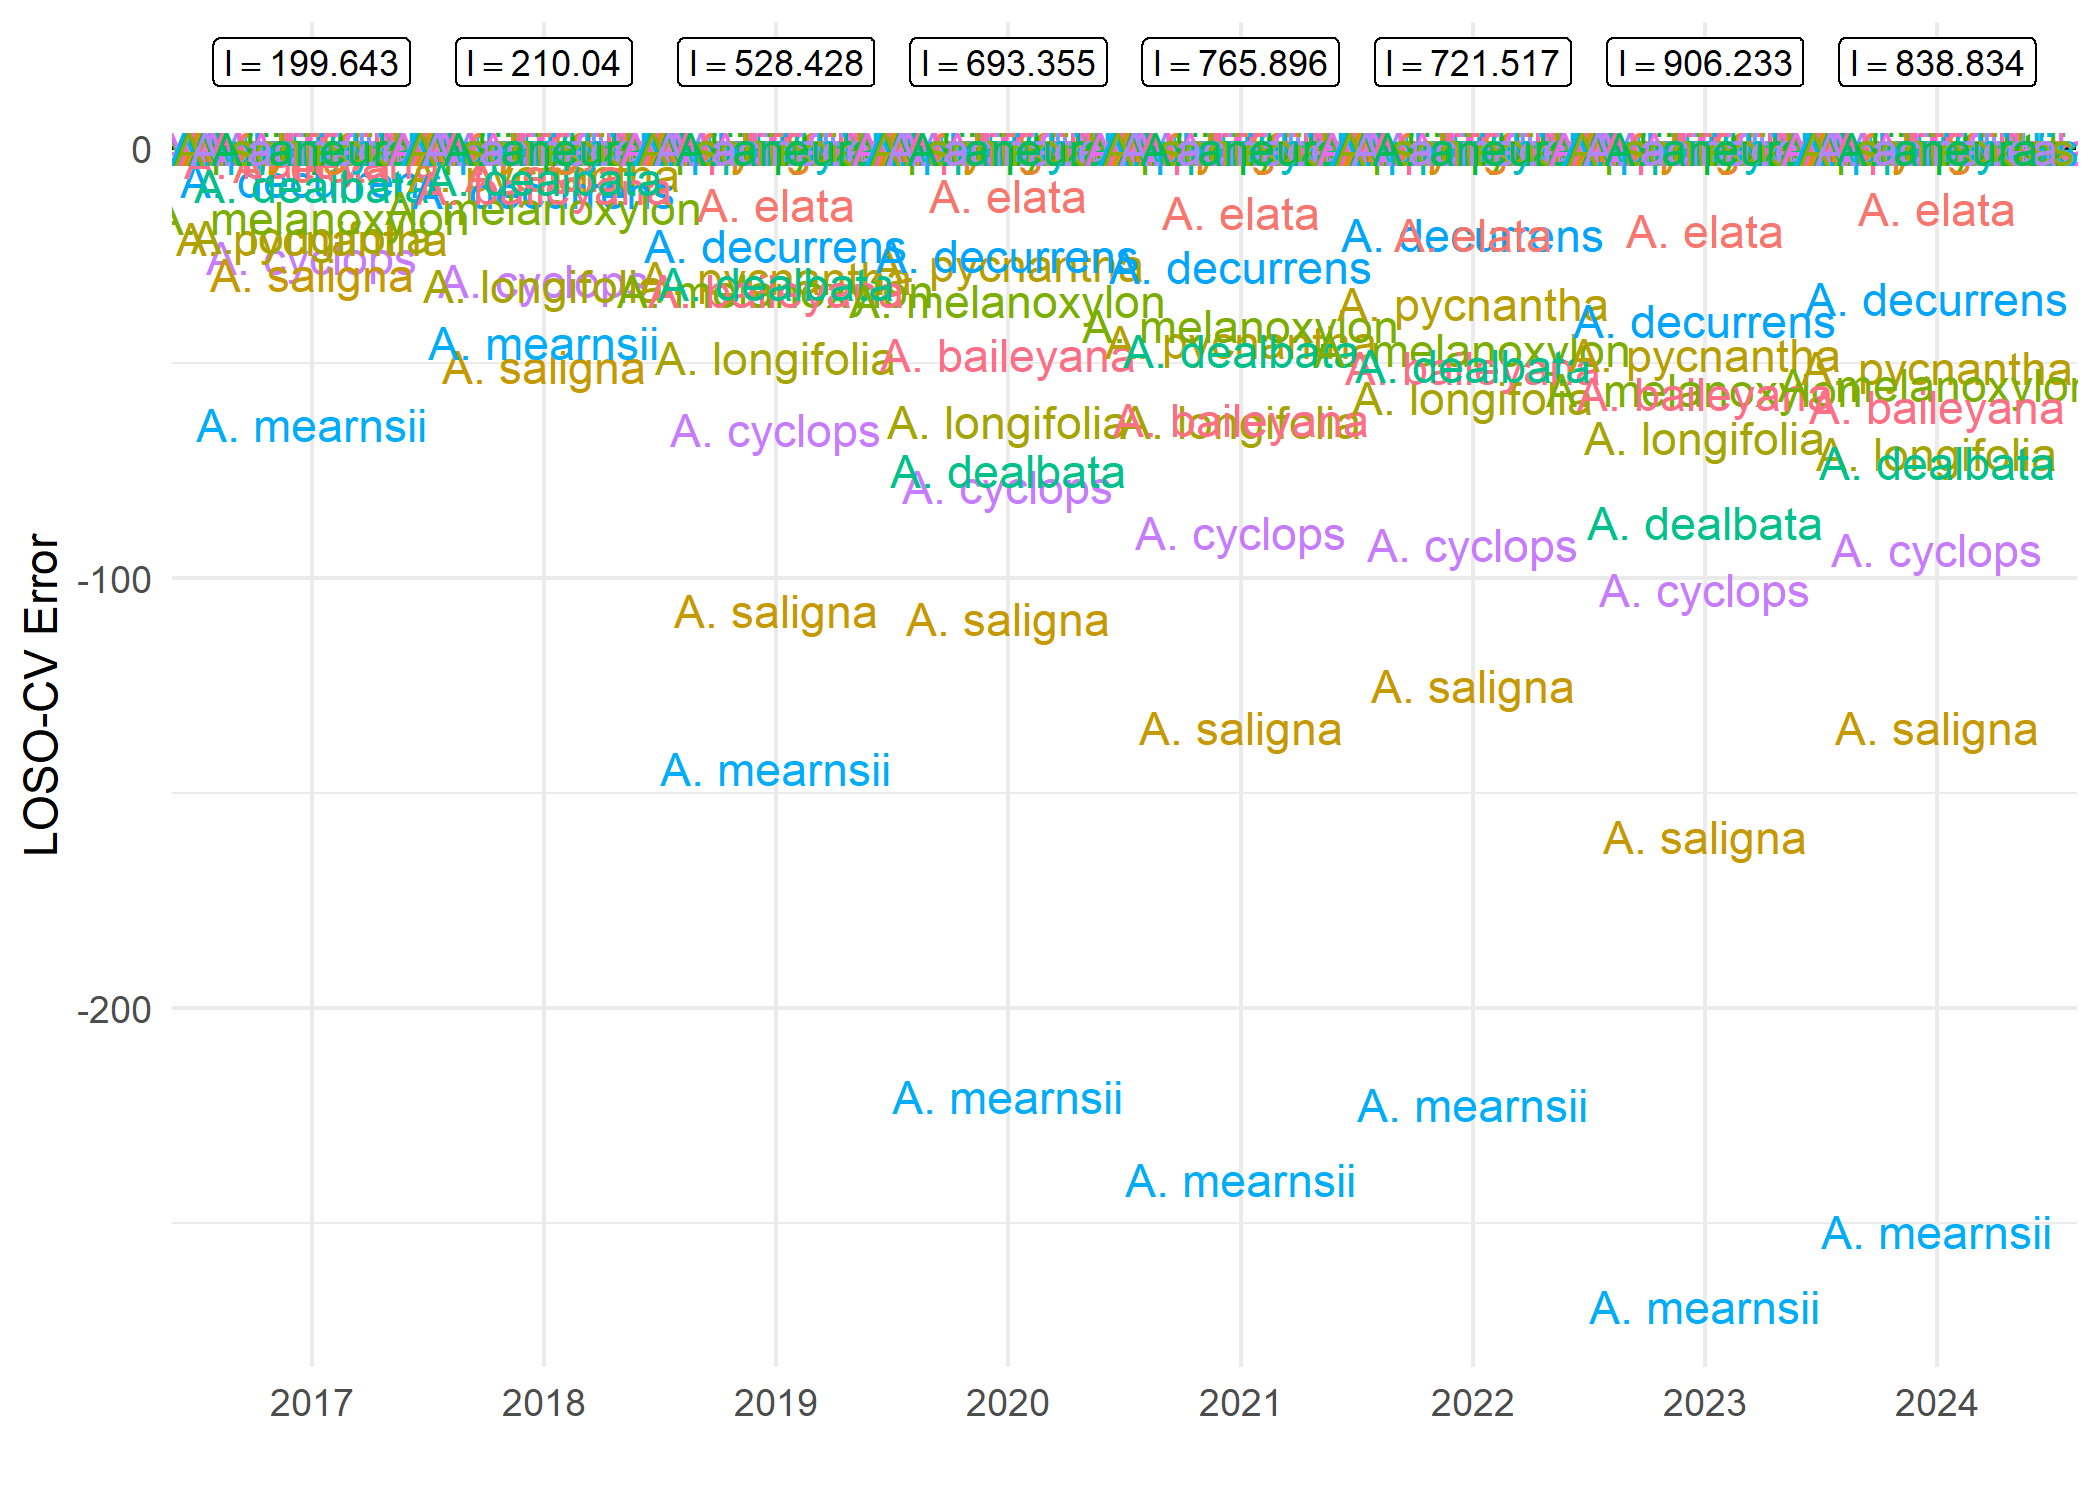
The above figure shows the impact indicator value and LOSO-CV Error of each species from the year 2017. The LOSO-CV indicates that the impact indicator value will increase (if positive) or decrease(if negative) by the corresponding value of where the species lies in the y-axis. The impact indicator is majorly influenced by Acacia saligna and Acacia mearnsii from the year 2019.